Data Interpretation bears the closest resemblance to the kind of problems that you as a manager would be tackling in your professional career. Data Interpretation has no particular syllabus. In Data Interpretation tests the questions will test your speed, decision making capability and analysing data. The questions consists of a graphs, charts and tables from which you will have to analyse data. Quickly identify the key pieces of data that you will require to work on the questions asked is the key to crack the problem.
Data represented in the form of a table is quite time consuming to analyses such as trends, problem areas, percentage distribution. Graphs on the other hand represent the same data visually and we can easily see the trends and distribution. Even problem areas are easy to identify by looking at the deviation from the trends. Representing data in the form of caselets is quite uncommon, however, it is very popular with car examiners. In this case, date is hidden between paragraphs and you have to unearth the data as you go on reading the paragraph. This is probably the worst case of data representation when it comes to analyzing and drawing conclusions out of it.
Data Sufficiency problems usually take the form of a logical puzzle, and are in the form of a question followed by two statements. The key to answering such problems is to pretend like one statement does not exist, try solving the problem, and then pretend like the other statement does not exist and try solving the problem again. These problems are generally tricky, and I would recommend lots of practice and perhaps solving them near the end of your section, after you have solved the other problems.
Some tips to score better in the Data Interpretation section:
1. Read the Question in parts: Most Data Interpretation questions will consist of a bunch of statistics, numbers & diagrams that might look scary, but are actually not at all difficult to solve. In fact the trend has been: the scarier a DI set/caselet looks, the easier it is to solve.
2. Improve your Calculation Skills/Speed: The Date Interpretation section is calculation-intensive. Such calculations can eat up your time. Learn shortcuts that will help you calculate fast.
3. Get familiar with all types of Data Interpretation questions: There will be bar charts, tables, pie charts etc. There will also be questions where a lot of text/information will be provided in 1 long paragraph.
4. Practice, practice, practice: With a very good amount of practice your speed and confidence will increase considerably.
Table Chart
Tabular method is the most fundamental way of representing data. In fact, most of the different kinds of data presentation formats like the bar charts, line charts etc. originate from the table. In other words, presenting the data in a tabular format is the first step in forming other types of data presentation formats.
Graphs
While tables express actual numbers, graphs are a diagrammatic representation of data. They bring out the relationship between data more clearly than numbers in a table. Graphs are far better to understand changes in variables - whether a particular value has risen or fallen over the past few years and hence analyze the trends.
Pie Charts
They always represent data in the form of a percentage of the total, with the total percentage being 100. In such a chart, the length of the arc (and therefore the angle each sector subtends at the centre) is proportional to the quantity it represents. Such charts are often used in the corporate world and in newspapers. Since a circle comprises 360 degrees, each percent of a pie-chart is equal to 360 divided by 100, or 3.6 degrees. This fact will be important for the calculations you are expected to perform.
Bar Graphs
Bar graphs represent data in the form of columns or bars. Bar graphs can be horizontal or vertical. The length of the bar is proportional to the data value represented by it.
Line Graphs
Line graph represents data in the form of straight lines that connect various data values. Both line graphs and bar graphs are used to convey same things and hence can be used inter-changeably. For example, a line graph can be generated by joining the tip of the bar graph.
Caselets
In caselets, the mathematical data is represented in the form of a paragraph. Hence extracting data and establishing relationships between different data values becomes difficult. However caselets are very popular with the CAT examiners.
Combined Data Sets
Data is represented in two or more different types of data sets. It could be combination of a table and a graph or two or more graphs. You may have to correlate the data in different data sets to solve these questions.
NOTE
Data Interpretation questions typically have large amounts of data given in the form of tables, pie-charts, line graphs or some non-conventional data representation format. The questions are calculation heavy and typically test your approximation abilities. A very large number of these questions check your ability to compare or calculate fractions and percentages. If you sit down to actually calculate the answer, you would end up spending more time than required. Here are few ideas that you can use for approximation.
A Summary of Strategies for Charts, Tables, and Graphs
Examine the entire graph, noticing labels and headings.
Focus on the information given.
Look for major changes—high points, low points, and trends.
Don’t memorize the chart, table, or graph; refer to it.
Skimming questions can be helpful.
Circle or underline important words in the question.
Pay special attention to which part of the chart, table, or graph the question is referring to.
If you don’t understand the graph, reread the labels and headings.
Don’t get stuck on any one question!
Data Interpretation Questions from previous year exams
Time limit: 0
Quiz-summary
0 of 50 questions completed
Questions:
1
2
3
4
5
6
7
8
9
10
11
12
13
14
15
16
17
18
19
20
21
22
23
24
25
26
27
28
29
30
31
32
33
34
35
36
37
38
39
40
41
42
43
44
45
46
47
48
49
50
Information
Data Analysis & Interpretation
You have already completed the quiz before. Hence you can not start it again.
Quiz is loading...
You must sign in or sign up to start the quiz.
You have to finish following quiz, to start this quiz:
Results
0 of 50 questions answered correctly
Your time:
Time has elapsed
You have reached 0 of 0 points, (0)
Average score
Your score
Categories
Not categorized0%
1
2
3
4
5
6
7
8
9
10
11
12
13
14
15
16
17
18
19
20
21
22
23
24
25
26
27
28
29
30
31
32
33
34
35
36
37
38
39
40
41
42
43
44
45
46
47
48
49
50
Answered
Review
Question 1 of 50
1. Question
1 points
(Q. Nos. 2-5) Study the following graph carefully to answer the questions that follow.
Cost of three different fruits (in rupees per kg) in five different cities
Cost of 1 kg of guava in Jalandhar is approximately what per cent of the cost of 2 kg of grapes in Chandigarh?
Correct
Incorrect
Cost of 1 kg guava in Jalandhar = Rs 60
and cost of 2kg grapes in Chandigarh=
.'. Required percentage = % = 34%
Question 2 of 50
2. Question
1 points
Cost of three different fruits (in rupees per kg) in five different cities
What total amount will Ram pay to the shopkeeper for purchasing 3 kg, of apples and 2 kg of guavas in Delhi?
Correct
Incorrect
Cost of 3 kg apples in Delhi =
Cost of 2 kg guava in Delhi =
.'. Total amount pay by Ram = (390 + 180) = Rs 570
Question 3 of 50
3. Question
1 points
Cost of three different fruits (in rupees per kg) in five different cities
Ravinder had to purchase 45 kg of grapes from Hoshiarpur. Shopkeeper gave him discount of 4o/o per kg. What amount did he pay to the shopkeeper after the discount?
Cost of three different fruits (in rupees per kg) in five different cities
What is the respective ratio between the cost of 1 kg of apples from Ropar and the cost of .1 kg of grapes from Chandigarh?
Correct
Incorrect
Cost of 1 kg apple in Ropar = Rs 40
Cost of 1 kg grapes in Chandigarh = Rs 90
.'. Required ratio=
Question 5 of 50
5. Question
1 points
Number of students (in thousand) in two different universities in six different years
Number of students
What was the difference between the number of students in university 1 in the year 2010 and the number of students in university 2 in the year 2012?
Correct
Incorrect
Number of students in university 1 in 2010 = 20000
number of students in university 2 in 2072 = 20000
.'. Required difference = 20000 - 20000 = 0
Question 6 of 50
6. Question
1 points
Number of students (in thousand) in two different
universities in six different years
Number of students
lf 25% of the students in university 2 in the year 2010 were females, what was the number of male students in the university 2 in the same year?
Correct
Incorrect
Total students in university 2i n 2010 = 15000
.'. Number of girls =
and number of boys = 15000 - 3750= 11250
Question 7 of 50
7. Question
1 points
Number of students (in thousand) in two different
universities in six different years
Number of students
What was the per cent increase in the number of students in university 1 in the year 2011 as compared to the previous year?
Correct
Incorrect
Number of students in university 1 in 2011 = 25000
and number of students in university 1 in 2010 = 20000
Required percentage =%
Question 8 of 50
8. Question
1 points
Number of students (in thousand) in two different
universities in six different years
Number of students
ln which year was the difference between the number of students in university 1 and the number of students in university 2 highest?
Correct
Incorrect
Difference between the students of university 1 and university 2 in 2007 = 20000 - 10000 = 10000
Difference in number of students in 2008 = 25000 - 15000 = 10000
Difference in number of students in 2009 = 35000 - 25000 = 10000
Difference in number of students in 2010 = 20000 - 15000 = 5000
Difference in number of students in 2011 = 30000 - 25000 = 5000
Difference in number of students in 2072 = 35000 - 20000 = 15000
It is clear from above that the difference between the number of students in university 1 and the number of students in university 2 is highest in the year 2012.
Question 9 of 50
9. Question
1 points
Number of players participating in three different games in five different schools
What is the total number of players participating in hockey from all the five schools together ?
Correct
Incorrect
From graph, the total number of players participating in hockey
= 68 + 80 + 54 + 50 + 36 = 288
Question 10 of 50
10. Question
1 points
Number of players participating in three different games in five different schools
What is the respective ratio between number of players participating in basketball from school 1 and the number of players participating in Kho-Kho from school 3?
Correct
Incorrect
Number of players participating in basketball from school 1= 42
and number of players participating in kho-kho from school 3=48
.'. Required ratio =
Question 11 of 50
11. Question
1 points
Number of players participating in three different games in five different schools
ln which school is the number of players participating in hockey and basketball together second highest?
Correct
Incorrect
Number of players participating in hockey and basketball from school 7 = 74 + 42 = 176
Number of players from school 2 = 80 + 34 = 174
Number of players from school 3 = 54 + 28 = 82
Number of players from school 4 = 50 + 60 = 110
Number of players from school 5 = 36 + 82 = 118
It is clear from above that the number of players participating in hockey and basketball together second highest is in school 1.
Question 12 of 50
12. Question
1 points
Number of players participating in three different games in five different schools
Number of players participating in Kho-Kho from school 4 is what percent of number of players participating in hockey from school 2?
Correct
Incorrect
Question 13 of 50
13. Question
1 points
Number of players participating in three different games in five different schools
25% of the number of the players participating in hockey from schools are females. What is the number of the hockey players who are males in School 5?
Correct
Incorrect
Number of school 5 = 36
Now, number of female players =
.'. Number of male players = 36 - 9 = 27
Question 14 of 50
14. Question
1 points
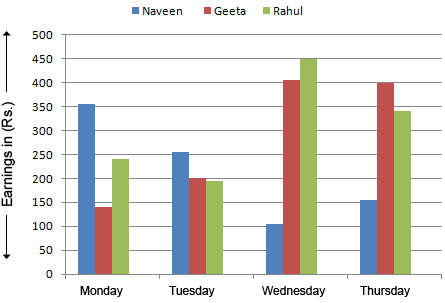
Earnings (in Rs ) of three different persons on four different days
What is Gita's average earnings over all the days together?
Correct
Incorrect
Average earnings of Geeta
Question 15 of 50
15. Question
1 points
Earnings (in Rs ) of three different persons on four different days
What is the total amount earned by Rahul and Naveen together on Tuesday and Thursday together?
Correct
Incorrect
The sum of earnings of Rahul and Naveen on Tuesday and Thursday
= 180 + 260 + 34O+ 160= Rs 940
Question 16 of 50
16. Question
1 points
Earnings (in Rs ) of three different person on four different days
Gita donated her earnings of Wednesday to Naveen' What was Naveen's total earnings on Wednesday after Gita's donation?
Correct
Incorrect
Total earning of Naveen on Wednesday, if Geeta donated her earning to him = 120 + 420 = Rs 540
Question 17 of 50
17. Question
1 points
Earnings (in Rs ) of three different person on four different days
What is the difference between Rahul's earnings on Monday and Gita's earnings on Tuesday?
Correct
Incorrect
Rahul's earning on Monday = Rs 240
Geeta's earning on Tuesday = Rs 200
.'. Required difference = 240 - 200 = Rs 40
Question 18 of 50
18. Question
1 points
Earnings (in Rs ) of three different persons on four different days
What is the respective ratio between Naveen's earnings on Monday, Wednesday and Thursday?
Correct
Incorrect
Naveen's earning on Monday = Rs 360
Naveen's earning on Wednesday = Rs 120
Naveen's earning on Thursday = Rs 160
.'.Required ratio = 360 : 120 : 160= 9 : 3 : 4
Question 19 of 50
19. Question
1 points
(Q. Nos. 21-25) Study the following pie chart and answer the following questions.
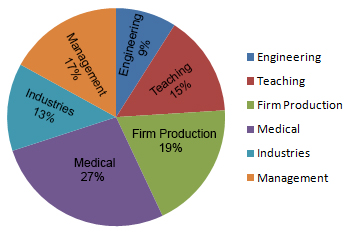
Percentage-wise distribution of employees in six different professions
Total number of employee = 26800
What is the difference between the total number of employees in teaching and medical profession together and the number of employees in management profession?
Correct
Incorrect
Employees in teaching =
Employees in medical =
and employees in management=
As per the question, Total employees in teaching and medical = 4020 + 7236 = 11256
Now, difference between total employees in teaching and medical and total employees in management = 11256 - 4556 = 6700
Question 20 of 50
20. Question
1 points
Percentage-wise distribution of employees in six different professions
Total number of employee = 26800
ln management profession three-fourth of the number of employees are female. What is the number of male employees in management profession?
Correct
Incorrect
Total employees in management =
.'. Female employees =
.'. Male employees = 4556 - 3477 = 1139
Question 21 of 50
21. Question
1 points
Percentage-wise distribution of employees in six different professions
Total number of employee = 26800
25% of employees from film production profession went on a strike. What is the number of employees from film production who have not participated in the strike?
Correct
Incorrect
Total employees in film production =
Number of employees went on strike =
Number of employees not go to strike 5092 - 1273= 3819
Question 22 of 50
22. Question
1 points
Percentage-wise distribution of employees in six different professions
Total number of employee = 26800
What is the total number of employees in engineering profession and industries together?
Correct
Incorrect
Total employees in engineering =
Total employees in industries =
.'. Total employees in engineering and industries = 2412 + 3484 = 5896
Question 23 of 50
23. Question
1 points
Percentage-wise distribution of employees in six different professions
Total number of employee = 26800
ln teaching profession if three-fifth of the teachers are not permanent, what is the number of permanent teachers in the teaching profession?
Correct
Incorrect
Total number of teachers
Number of temporary teachers
.'. Number of permanent teachers = 4020 - 2412= 1608
Question 24 of 50
24. Question
1 points
Study the following table carefully and answer the questions that follows.
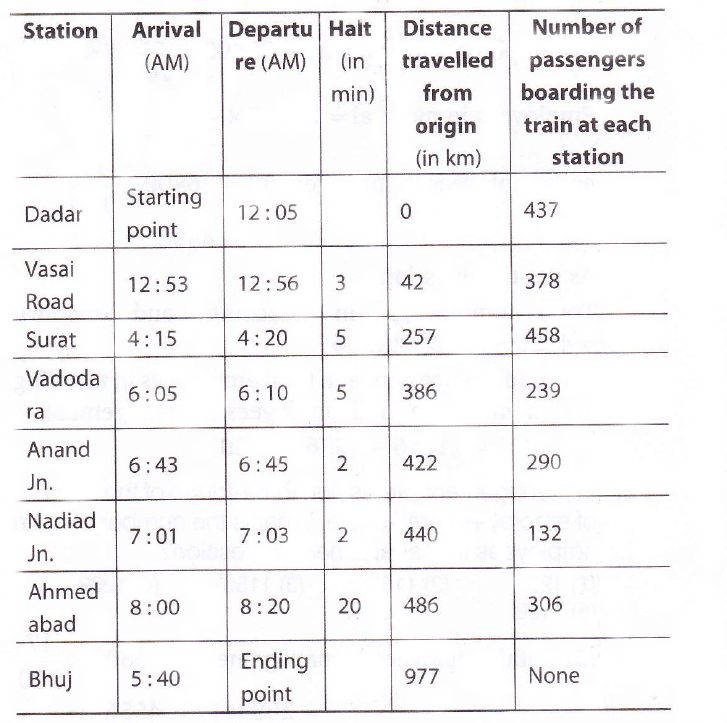
Chart showing schedule of train from Dadar to Bhuj and number of passengers boarding from each station
Distance between which two stations is second lowest?
Correct
Incorrect
lt is clear from the given table that distance between Anand Jn. to Vadodara is second lowest'
Question 25 of 50
25. Question
1 points
Study the table carefully to o answer the questions that follow.
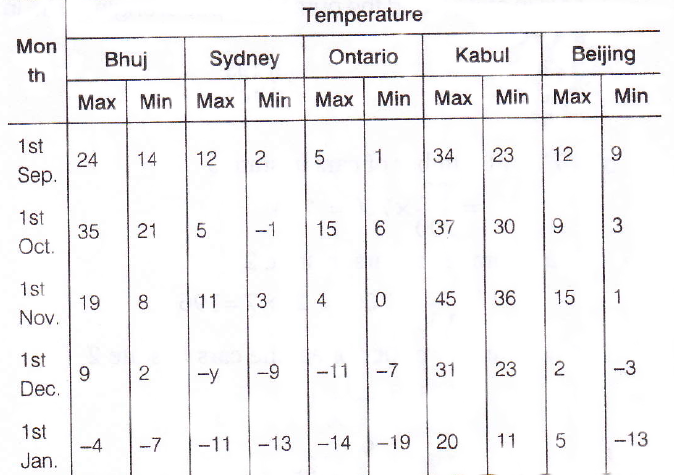
Maximum and minimum temperature (in degree Celsius) recorded on 1 " day of each month of five different Cities
ln which month respectively the maximum temperature of Kabul is second highest and minimum temperature oi SydneY is highest?
Correct
Incorrect
lt is clear from given table that on 1st October, - temperature of Kabul is second highest and on 1st Novlmber, temPerature of Sydney is the highest
Question 26 of 50
26. Question
1 points
(Q. No: 41-45) Carefully to answer the questions that follow.
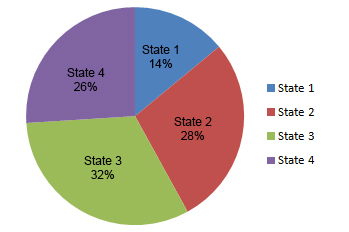
Pie-chart showing percentage wise distribution of cars in four different states
Table showing ratio between diesel and petrol engine cars which are distributed among four different states
States
Diesels Engine Cars
Petrol Engine Cars
States 1
3
4
States 2
5
9
States 3
5
3
States 4
1
1
What is the difference between the number of diesel engine cars in state 2 and the number of petrol engine cars in state 4?
Correct
Incorrect
Total number of cars in state 2
Now, number of diesel engine cars in state 2
Total number of cars in state 4=
Now, number of petrol engine cars in state 4=
.'. Required difference = 97 - 70 = 21
Question 27 of 50
27. Question
1 points
A bag contains 7 blue balls and 5 yellow balls. If two balls are selected at random, what is the probability that none is yellow?
Correct
Total balls in the bags
= 7 blue + 5 yellow
= 12 Balls
Number way to choose 2 balls out of 12 =
=
Now out of two balls, ways yellow colours not come
= =
Required Probability =
Incorrect
Total balls in the bags
= 7 blue + 5 yellow
= 12 Balls
Number way to choose 2 balls out of 12 =
=
Now out of two balls, ways yellow colours not come
= =
Required Probability =
Question 28 of 50
28. Question
1 points
Study the following table carefully and answer the questions that follows.
Chart showing schedule of train from Dadar to Bhuj and number of passengers boarding from each station
What is the distance travelled by the train from Surat to Nadiad Jn.?
Correct
Incorrect
Distance travelled by train from Surat to Nadiad function = 440 - 257 = 183 km
Question 29 of 50
29. Question
1 points
Study the table carefully to answer the question that follows.
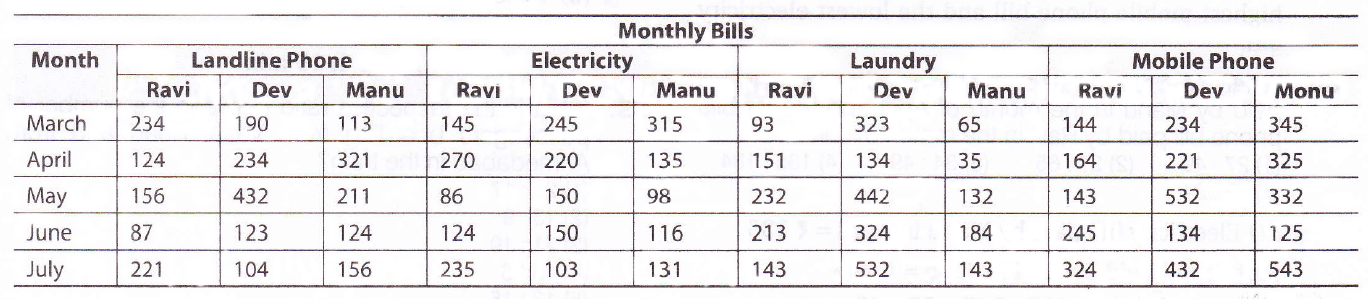
Monthly Bill (in Rs) of landline phone, electricity, laundry and mobile phone paid by three different people in five different months
What is the respective ratio between the electricity bill paid by Manu in the month of April and the mobile phone bill paid by Ravi in the month of June?
Correct
Incorrect
Electricity bill paid by Manu in April = Rs 135
Mobile bill paid by Ravi in June = Rs 245
.'. Required ratio = 735: 245= 27 : 49
Question 30 of 50
30. Question
1 points
Study the table carefully to answer the question that follows.
Monthly Bill (in Rs) of landline phone, electricity, laundry and mobile phone paid by three different people in five different months
ln which months respectively did Manu pay the second highest mobile phone bill and the lowest electricity bill?
Correct
Incorrect
From the given table, it is clear that April and May months respectively, Manu pay the second highest mobile phone bill and the lowest electricity bill.
Question 31 of 50
31. Question
1 points
Study the table carefully to answer the question that follows.
Monthly Bill (in Rs) of landline phone, electricity, laundry and mobile phone paid by three different people in five different months
What is the difference between the mobile phone bill paid by Ravi in the month of May and the'laundry bill paid by Dev in the month of March?
Correct
Incorrect
The mobile bill paid by Ravi in the month of May =Rs 143
and the laundry bill paid by Dev in the month of March = Rs 323
.'. Required difference = 323 - 143 = Rs 180
Question 32 of 50
32. Question
1 points
Study the table carefully to answer the question that follows.
Monthly Bill (in Rs) of landline phone, electricity, laundry and mobile phone paid by three different people in five different months
What is the average electricity bill paid by Manu over all the five months together?
Correct
Incorrect
The average electriciry bill paid by Manu over all the five months together
Question 33 of 50
33. Question
1 points
Study the table carefully to answer the question that follows.
Monthly Bill (in Rs) of land line phone, electricity, laundry and mobile phone paid by three different people in five different months
What is the total amount of bill paid by Dev in the month of June for all the four commodities?
Correct
Incorrect
Total amount paid by Dev for all the four commodities in the month of June
= 123 + 150 + 324 + 134 = 731
Question 34 of 50
34. Question
1 points
Study the following table carefully and answer the questions that follows.
Chart showing schedule of train from Dadar to Bhuj and number of passengers boarding from each station
How much time does the train take to reach Ahmedabad after departing from Anand Jn. (including the halt time)?
Correct
Incorrect
Time taken by train = 8: 00 - 6:45 = 1:15= 1 h 15 min
Question 35 of 50
35. Question
1 points
Study the following table carefully and answer the questions that follows.
Chart showing schedule of train from Dadar to Bhuj and number of passengers boarding from each station
What is the respective ratio between the number of passengers boarding from Vasai Road and from Ahmedabad in the train?
Correct
Incorrect
Number of passengers boarding from Vasai Road = 378
Number of passengers boarding from Ahmedabad = 306
.'. Required ratio = 378 : 306 = 21 :17
Question 36 of 50
36. Question
1 points
Study the following table carefully and answer the questions that follows.
Chart showing schedule of train from Dadar to Bhuj and number of passengers boarding from each station
lf halt time (stopping time) of the train at Vadodara is decreased by 2 min and increased by 23 min-at Ahmedabad. At what time will the train reach Bhuj?
Correct
Incorrect
Total halt time = 23 - 2 = 2 min
.'. Train time of reaching Bhuj =5:40 Pm + 21 min=6:01 Pm
Question 37 of 50
37. Question
1 points
Study the table carefully to o answer the questions that follow.
Maximum and minimum temperature (in degree Celsius) recorded on 1 " day of each month of five different Cities
What is the difference between the maximum temperature of Ontario on 1st November and the minimum temperature of Bhujon 1st January?
Correct
Incorrect
Maximum temperature of Ontario on 1st November = 4 C
and minimum temperature of Bhuj on 1st January = -7"C
.'.Required difference = 4- (-7)= 4+7 = 11 C
Question 38 of 50
38. Question
1 points
Study the table carefully to o answer the questions that follow.
Maximum and minimum temperature (in degree Celsius) recorded on 1 " day of each month of five different Cities
ln which month (on 1st day) is the difference between maximum temperature and minimum temperature of Bhuj second highest?
Correct
Incorrect
Difference between maximum temperature and - minimum temperature of Bhuj is second highest 19 - 8 = 11, on 1st November
Question 39 of 50
39. Question
1 points
Study the table carefully to o answer the questions that follow.
Maximum and minimum temperature (in degree Celsius) recorded on 1 " day of each month of five different Cities
What is the average maximum temperature of Beijing over all the months together
Correct
Incorrect
Average maximum temperature of Beijing
Question 40 of 50
40. Question
1 points
Study the table carefully to o answer the questions that follow.
Maximum and minimum temperature (in degree Celsius) recorded on 1 " day of each month of five different Cities
What is the respective ratio between the minimum temperature of Beijing on 1st September and the maximum temperature of On train on l st October?
Correct
Incorrect
Minimum temperature of Beijing on 1st September = 9"C
and maximum temperature of Ontario on 1st October = 15"C
.'. Required ratio =9:15=3:5
Question 41 of 50
41. Question
1 points
Pie-chart showing percentage wise distribution of cars in four different states
Table showing ratio between diesel and petrol engine cars which are distributed among four different states
States
Diesels Engine Cars
Petrol Engine Cars
States 1
3
4
States 2
5
9
States 3
5
3
States 4
1
1
What is the average number of petrol engine cars in all the states together?
Correct
Incorrect
Total number of cars in state 1=
Total number of cars in state 2=
Total number of cars in state 3=
Total number of cars in state 3=
Now, number of petrol engine cars in state 1=
Number of petrol engine cars in state 2=
Number of petrol engine cars in state 3=
Number of petrol engine cars in state 4=
.'. Average total number of petrol engine cars in all states
Question 42 of 50
42. Question
1 points
Cost of three different fruits (in rupees per kg) in five different cities
ln which city is 'the difference between the cost of 1 kg of apple and cost of 1 kg of guava second lowest?
Correct
Incorrect
Difference in cost in Jalandhar = 160 - 60 = Rs 100
Difference in cost in Delhi = 130 - 90 = Rs 40
Difference in cost in Chandigarh = 180 - 120 =Rs60
Difference in cost in Hoshiarpur = 90 - 30 = Rs 60
Difference in cost in Ropar = 40 - 20 = Rs 20
So, second lowest difference in cost is in Delhi
Question 43 of 50
43. Question
1 points
Number of students (in thousand) in two different
universities in six different years
Number of students
What is the sum of the number of students university 1 in the year 2007 and the number students in university 2 in the year 2011 together?
Correct
Incorrect
Number of students in university 7 in 2007 = 10000
Number of students ir universiry 2 in 2011= 30000
.'. Required sum = 10000 + 30000 = 40000
Question 44 of 50
44. Question
1 points
Pie-chart showing percentage wise distribution of cars in four different states
Table showing ratio between diesel and petrol engine cars which are distributed among four different states
States
Diesels Engine Cars
Petrol Engine Cars
States 1
3
4
States 2
5
9
States 3
5
3
States 4
1
1
Number of petrol engine cars in state 3 is what percent more than the number of diesel engine cars in state 1?
Correct
Incorrect
Total number of cars in state 3 =
Now, number of petrol engine cars in state 3=
and total number of cars in state 1 =
Now, number of diesel engine cars in state 1=
.'. Required percentage = %
Question 45 of 50
45. Question
1 points
Pie-chart showing percentage wise distribution of cars in four different states
Table showing ratio between diesel and petrol engine cars which are distributed among four different states
States
Diesels Engine Cars
Petrol Engine Cars
States 1
3
4
States 2
5
9
States 3
5
3
States 4
1
1
lf 25% of diesel engine cars in siate 3 are AC and remaining cars are non-AC, what is the number of diesel engine cars in state 3 which are non-AC?
Correct
Incorrect
Total number of cars in state 3=
Now, the number of diesel engine A cars in state 3 =
Number of diesel engine AC cars in state 3=
Number of Non- AC diesel engine cars= 140- 35= 105
Question 46 of 50
46. Question
1 points
Pie-chart showing percentage wise distribution of cars in four different states
Table showing ratio between diesel and petrol engine cars which are distributed among four different states
States
Diesels Engine Cars
Petrol Engine Cars
States 1
3
4
States 2
5
9
States 3
5
3
States 4
1
1
What is the difference between the total number of cars in state 3 and the number of petrol engine cars in state-2?
Correct
Incorrect
Total number of cars in state 3=
Total number of cars in state 2=
Now, number of petrol engine cars in state 2=
.'. Required difference = 224 - 126 = 98
Question 47 of 50
47. Question
1 points
A die is thrown twice. What is the probability of getting a sum 7 From both the throws?
Correct
Incorrect
Question 48 of 50
48. Question
1 points
Study the information carefully to answer these questions.
In a team there are 240 members (males and females). Two-third of them are males. Fifteen percent of males are graduates. Remain in g males are non-graduates. Three-fourth
of the females are graduates. Remaining females are non-graduates.
What is the difference between the number of females who are non-graduates and the number of males who are graduates?
Correct
Number of Males in team =
Number of Females in team = 240-160 = 80
Number of graduates Males =
Number of graduates Females =
Number of Non-graduates females = 80 - 60 = 20
Difference between non-graduate female and graduate female = 24 - 20 = 4
Incorrect
Number of Males in team =
Number of Females in team = 240-160 = 80
Number of graduates Males =
Number of graduates Females =
Number of Non-graduates females = 80 - 60 = 20
Difference between non-graduate female and graduate female = 24 - 20 = 4
Question 49 of 50
49. Question
1 points
Study the information carefully to answer these questions.
In a team there are 240 members (males and females). Two-third of them are males. Fifteen percent of males are graduates. Remain in g males are non-graduates. Three-fourth
of the females are graduates. Remaining females are non-graduates.
What is the sum of the number of females who are graduates and the number of males who are non-graduates?
Correct
Number of graduate females = 60
Number of graduate males = 24
Number of non-graduate males = 160 - 24= 136
Total number of graduate females and
non-graduate males = 60 +136= 196
Incorrect
Number of graduate females = 60
Number of graduate males = 24
Number of non-graduate males = 160 - 24= 136
Total number of graduate females and
non-graduate males = 60 +136= 196
Question 50 of 50
50. Question
1 points
Study the information carefully to answer these questions.
In a team there are 240 members (males and females). Two-third of them are males. Fifteen percent of males are graduates. Remain in g males are non-graduates. Three-fourth
of the females are graduates. Remaining females are non-graduates.
What is the ratio between the total number of males and the number of females who are non-graduates?
Correct
Total number of males = 160
and number of non- graduate females = 20
Required ratio = 160 : 20= 8 : 1
Incorrect
Total number of males = 160
and number of non- graduate females = 20
Required ratio = 160 : 20= 8 : 1
Please comment on Data Interpretation Syllabus and Study Material


Please recheck the question number10